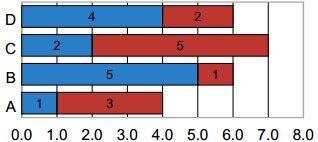
PDF stacked bar charts are Multi-Series charts which show two or more similar set of data together in a single chart. The data Points for each series in PDF bar charts are stacked one on top of the other. Multiple sets of data are represented by one Bar. Contribution of each value is displayed in different colors and the total length of bar is Cumulative Sum of all the data Elements.
.NET PDF Stacked Bar Chart Maker offers the most mature and complete chart generating APIs for developers to create amazing, fully-featured charting rendering applications to create and make stacked bar chart in PDF documents from multiple Visual .NET applications, such as C#, VB.NET, ASP.NET and WinForms. This tutorial article mainly demonstrates the stacked bar chart making on PDF document pages in an easy way.
static void AddStackedBarChartToPDF()
{
    // Create a new PDF document.
    PdfDocument document = new PdfDocument();

    // Create a page.
    PdfPage page = document.AddPage();

    // Generate a 2d stacked bar chart graph
    Chart chart = BarStackedChart();

    // Create a chart frame, set chart location and size
    ChartFrame chartFrame = new ChartFrame();
    chartFrame.Location = new XPoint(30, 30);
    chartFrame.Size = new XSize(500, 600);
    chartFrame.Add(chart);

    // Render chart symbols into pdf page
    XGraphics g = XGraphics.FromPdfPage(page);
    chartFrame.Draw(g);

    // Save and show the document
    document.Save("StactedBarChart.pdf");
    Process.Start("StactedBarChart.pdf");
}

static Chart BarStackedChart()
{
    // Set chart type to BarStacked2D
    Chart chart = new Chart(ChartType.BarStacked2D);

    // Add first series of stacked bar chart with name and data
    Series series = chart.SeriesCollection.AddSeries();
    series.Name = "Series 1";
    series.Add(new double[] { 1, 5, -3, 20, 11 });

    // Add second series of stacked bar chart with name and data
    series = chart.SeriesCollection.AddSeries();
    series.Name = "Series 2";
    series.Add(new double[] { 22, 4, 12, 8, 12 });

    // Add third series of stacked bar chart with name and data
    series = chart.SeriesCollection.AddSeries();
    series.Name = "Series 3";
    series.Add(new double[] { 12, 14, 2, 18, 1 });

    // Add fourth series of stacked bar chart with name and data
    series = chart.SeriesCollection.AddSeries();
    series.Name = "Series 4";
    series.Add(new double[] { 17, 13, 10, 9, 15 });

    // Set X axes
    chart.XAxis.TickLabels.Format = "00";
    chart.XAxis.MajorTickMark = TickMarkType.Outside;
    chart.XAxis.Title.Caption = "X-Axis";

    // Set Y axes
    chart.YAxis.MajorTickMark = TickMarkType.Outside;
    chart.YAxis.HasMajorGridlines = true;

    // Set plot area (chart diagram)
    chart.PlotArea.LineFormat.Color = XColors.DarkGray;
    chart.PlotArea.LineFormat.Width = 1;
    chart.PlotArea.LineFormat.Visible = true;

    // Set legend
    chart.Legend.Docking = DockingType.Right;

    chart.DataLabel.Type = DataLabelType.Value;
    chart.DataLabel.Position = DataLabelPosition.Center;

    return chart;
}
More Excel tutorial
- Drawing Area chart to PDF page using CSharp .NET and XsPDF Component
- Jpeg transformed from PDF document online tutorial
- Encode QRCode barcode to PDF in C#
- How to drawing Data Matrix ECC200 to PDF document in Winforms using Visual C#
- Barcode adding to PDF in Visual C# is quite easy and quick using XsPDF barcode Toolkit for .NET

