This C#.NET guide demonstrates how to generate the Microsoft 100% Stacked Bar Chart (both 2D and 3D types of 100% Stacked Bar Chart), and insert the MS 100% Stacked Bar Chart image to PDF document.
Bar stacked-100 chart color, location and size can be customized by programmers. The following C# sample code shows how to create and insert Microsoft Stacked 100% Bar Chart to PDF document programmatically.
Please note, before developers using the chart creating code, the MS Chart Control should be referred to your .NET program:
- System.Windows.Forms.DataVisualization.Charting (for .NET WinForms project)
- System.Web.UI.DataVisualization.Charting (for ASP.NET application)
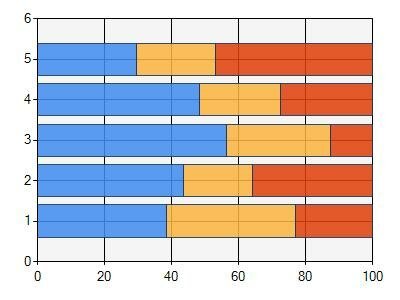
Make and render Microsoft 2D 100% Stacked Bar Chart to PDF in C# code.
public static void InsertMSChartToPDF()
{
    // Create a new PDF document.
    PdfDocument document = new PdfDocument();

    // Create an empty page in this document.
    PdfPage page = document.AddPage();

    // Obtain an XGraphics object to render to
    XGraphics g = XGraphics.FromPdfPage(page);

     // Create stacked 100 bar chart stream object
    Stream chartStream = CreateMSStacked100BarChart();

    // Convert chart stream to XImage object
    XImage chartImage = XImage.FromStream(chartStream);

    // Insert the chart image to pdf page in any position
    g.DrawImage(chartImage, 50, 50);

    // Save and show the document
    document.Save("MSStacked100BarChart.pdf");
    Process.Start("MSStacked100BarChart.pdf");
}

public static Stream CreateMSStacked100BarChart()
{
    // Create ms chart object
    Chart chart = new Chart();

    ChartArea chartArea = new ChartArea();
    Series series1 = new Series();
    Series series2 = new Series();
    Series series3 = new Series();

    // Input Data Point
    DataPoint dataPoint1 = new DataPoint(0, 5);
    DataPoint dataPoint2 = new DataPoint(0, 8.5);
    DataPoint dataPoint3 = new DataPoint(0, 9);
    DataPoint dataPoint4 = new DataPoint(0, 7);
    DataPoint dataPoint5 = new DataPoint(0, 5);
    DataPoint dataPoint6 = new DataPoint(0, 5);
    DataPoint dataPoint7 = new DataPoint(0, 4);
    DataPoint dataPoint8 = new DataPoint(0, 5);
    DataPoint dataPoint9 = new DataPoint(0, 3.5);
    DataPoint dataPoint10 = new DataPoint(0, 4);
    DataPoint dataPoint11 = new DataPoint(0, 3);
    DataPoint dataPoint12 = new DataPoint(0, 7);
    DataPoint dataPoint13 = new DataPoint(0, 2);
    DataPoint dataPoint14 = new DataPoint(0, 4);
    DataPoint dataPoint15 = new DataPoint(0, 8);

    // Set series1 with data, color, chart type and name
    series1.BorderColor = Color.FromArgb(180, 26, 59, 105);
    series1.ChartType = SeriesChartType.StackedBar100;
    series1.Color = Color.FromArgb(220, 65, 140, 240);
    series1.Name = "Series1";
    series1.Points.Add(dataPoint1);
    series1.Points.Add(dataPoint2);
    series1.Points.Add(dataPoint3);
    series1.Points.Add(dataPoint4);
    series1.Points.Add(dataPoint5);

    // Set series2 with data, color, chart type and name
    series2.BorderColor = Color.FromArgb(180, 26, 59, 105);
    series2.ChartType = SeriesChartType.StackedBar100;
    series2.Color = Color.FromArgb(220, 252, 180, 65);
    series2.Name = "Series2";
    series2.Points.Add(dataPoint6);
    series2.Points.Add(dataPoint7);
    series2.Points.Add(dataPoint8);
    series2.Points.Add(dataPoint9);
    series2.Points.Add(dataPoint10);

    // Set series3 with data, color, chart type and name
    series3.BorderColor = Color.FromArgb(180, 26, 59, 105);
    series3.ChartType = SeriesChartType.StackedBar100;
    series3.Color = Color.FromArgb(220, 224, 64, 10);
    series3.Name = "Series3";
    series3.Points.Add(dataPoint11);
    series3.Points.Add(dataPoint12);
    series3.Points.Add(dataPoint13);
    series3.Points.Add(dataPoint14);
    series3.Points.Add(dataPoint15);

    // Bind series data to chart
    chart.Series.Add(series1);
    chart.Series.Add(series2);
    chart.Series.Add(series3);

    // Set chart 3D style
    chartArea.Area3DStyle.Enable3D = false;

    // Bind chart area to chart object
    chart.ChartAreas.Add(chartArea);

    // Modify chart size
    chart.Size = new Size(400, 300);

    // Render chart graphics to stream
    MemoryStream ms = new MemoryStream();
    chart.SaveImage(ms, ChartImageFormat.Png);

    return ms;
}
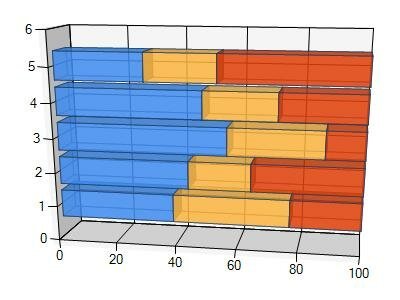
Generate and paint MS 3D 100% Stacked Bar Chart to PDF in C# code.
All the step and code are the same as above, only need change one line code chartArea.Area3DStyle.Enable3D = false; in the "CreateMSStacked100BarChart()" to the C# code below.
chartArea.Area3DStyle.Enable3D = true;
chartArea.Area3DStyle.Inclination = 15;
chartArea.Area3DStyle.IsRightAngleAxes = false;
chartArea.Area3DStyle.Perspective = 10;
chartArea.Area3DStyle.Rotation = 10;
chartArea.BackColor = Color.WhiteSmoke;
More MS Chart to PDF tutorial
- MS Doughnut graphing generated to PDF document - C#.NET sample code
- Microsoft Bar graphs painting to PDF in Visual Studio .NET framework is quite easy and quick using XsPDF Toolkit for .NET
- How to use XsPDF source code for .NET to add MS 100% Stacked Bar diagram to PDF page in Visual Studio .NET framework
- How to generate MS Polar chart to PDF document in Winform program using CSharp .NET
- Microsoft Stacked Bar graphing inserted to PDF document - C#.NET sample
- MS Bubble graphing saving to PDF in C# is quite easy and quick using XsPDF source code for .NET
- Create Microsoft Spline Range chart to PDF in C#
- Create Microsoft Radar chart to PDF in Visual C#
- Making Microsoft Range chart to PDF using Visual Studio .NET framework and XsPDF source code
- How to convert Microsoft Stacked Column diagram to PDF document in ASP.NET MVC using Visual C#
- C# online guide for making Microsoft Line chart to PDF file
- Microsoft 100% Stacked Column chart adding to PDF in .NET Visual C# is quite easy and quick using XsPDF Control for .NET
- MS Funnel diagram creation to PDF in .NET Visual C# is quite easy and quick using XsPDF Library for .NET
- How to use XsPDF Component for .NET to add Microsoft Stacked Area diagram to PDF page in C#.NET
- MS Range Column chart saved to PDF document - Visual C# guide