This C# tutorial demonstrates how to make the Microsoft Spline Area Chart (both 2D and 3D Spline Area Chart), and insert the MS Spline Area Chart image to PDF file.
The C# .NET language sample code below shows how to save MS Spline Area Chart to PDF document easily and quickly.
Please note, before developers using the chart creating code, the MS Chart Control library should be referred to your .NET project:
- System.Windows.Forms.DataVisualization.Charting (for .NET WinForms project)
- System.Web.UI.DataVisualization.Charting (for ASP.NET application)
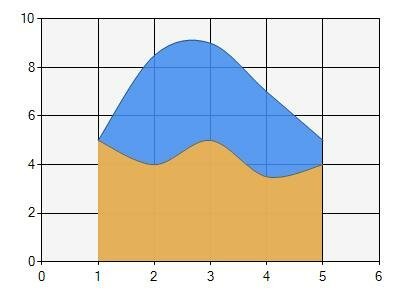
Insert or save Microsoft 2D Spline Area Chart to PDF in C# code.
public static void InsertMSChartToPDF()
{
    // Create a new PDF document.
    PdfDocument document = new PdfDocument();

    // Create an empty page in this document.
    PdfPage page = document.AddPage();

    // Obtain an XGraphics object to render to
    XGraphics g = XGraphics.FromPdfPage(page);

    // Create spline area chart stream object
    Stream chartStream = CreateMSSplineAreaChart();

    // Convert chart stream to XImage object
    XImage chartImage = XImage.FromStream(chartStream);

    // Insert the chart image to pdf page in any position
    g.DrawImage(chartImage, 50, 50);

    // Save and show the document
    document.Save("MSSplineAreaChart.pdf");
    Process.Start("MSSplineAreaChart.pdf");
}

public static Stream CreateMSSplineAreaChart()
{
    // Create ms chart object
    Chart chart = new Chart();

    ChartArea chartArea = new ChartArea();
    Series series1 = new Series();
    Series series2 = new Series();

    // Input Data Point
    DataPoint dataPoint1 = new DataPoint(0, 5);
    DataPoint dataPoint2 = new DataPoint(0, 8.5);
    DataPoint dataPoint3 = new DataPoint(0, 9);
    DataPoint dataPoint4 = new DataPoint(0, 7);
    DataPoint dataPoint5 = new DataPoint(0, 5);
    DataPoint dataPoint6 = new DataPoint(0, 5);
    DataPoint dataPoint7 = new DataPoint(0, 4);
    DataPoint dataPoint8 = new DataPoint(0, 5);
    DataPoint dataPoint9 = new DataPoint(0, 3.5);
    DataPoint dataPoint10 = new DataPoint(0, 4);

    // Set series1 with data, color, chart type and name
    series1.BorderColor = Color.FromArgb(180, 26, 59, 105);
    series1.ChartType = SeriesChartType.SplineArea;
    series1.Color = Color.FromArgb(220, 65, 140, 240);
    series1.Name = "Series1";
    series1.Points.Add(dataPoint1);
    series1.Points.Add(dataPoint2);
    series1.Points.Add(dataPoint3);
    series1.Points.Add(dataPoint4);
    series1.Points.Add(dataPoint5);

    // Set series2 with data, color, chart type and name
    series2.BorderColor = Color.FromArgb(180, 26, 59, 105);
    series2.ChartType = SeriesChartType.SplineArea;
    series2.Color = Color.FromArgb(220, 252, 180, 65);
    series2.Name = "Series2";
    series2.Points.Add(dataPoint6);
    series2.Points.Add(dataPoint7);
    series2.Points.Add(dataPoint8);
    series2.Points.Add(dataPoint9);
    series2.Points.Add(dataPoint10);

    // Bind series data to chart
    chart.Series.Add(series1);
    chart.Series.Add(series2);

    // Set chart 3D style
    chartArea.Area3DStyle.Enable3D = false;

    // Bind chart area to chart object
    chart.ChartAreas.Add(chartArea);

    // Modify chart size
    chart.Size = new Size(400, 300);

    // Render chart graphics to stream
    MemoryStream ms = new MemoryStream();
    chart.SaveImage(ms, ChartImageFormat.Png);

    return ms;
}
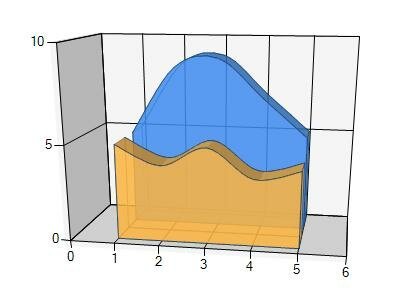
Make and save MS 3D Spline Area Chart to PDF in C# code.
All the step and code are the same as above, only need change the chartArea.Area3DStyle.Enable3D = false; in the "CreateMSSplineAreaChart()" to the following C# language code.
chartArea.Area3DStyle.Enable3D = true;
chartArea.Area3DStyle.Inclination = 15;
chartArea.Area3DStyle.IsRightAngleAxes = false;
chartArea.Area3DStyle.Perspective = 10;
chartArea.Area3DStyle.Rotation = 10;
chartArea.BackColor = Color.WhiteSmoke;
More MS Chart to PDF tutorial
- MS 100% Stacked Bar graphs creation to PDF in C# is quite easy and quick using XsPDF Component for .NET
- Microsoft Pyramid graphing made to PDF document - C#.NET guide
- .NET Visual C# online demo for drawing MS Spline Range graphing to PDF file
- Microsoft Bubble diagram converting to PDF in C#.NET is quite easy and quick using XsPDF Control for .NET
- Microsoft Doughnut chart inserted to PDF document - .NET C# online guide
- Adding Microsoft Radar graphs to PDF using C#.NET and XsPDF SDK
- MS Stacked Bar chart making to PDF in Visual C# is quite easy and quick using XsPDF Control for .NET
- Make MS Line graphs to PDF in .NET C#
- .NET C# sample for saving MS Stacked Area diagram to PDF file
- Save Microsoft Range Column chart to PDF in CSharp .NET
- How to make MS Range chart to PDF document in ASP.NET web page using .NET C#
- Creating Microsoft Polar diagram to PDF using C# and XsPDF Library
- Creating Microsoft Point graphs to PDF using C#.NET and XsPDF Library
- MS Spline Area graphs made to PDF document - C#.NET sample code
- Visual Studio .NET framework online tutorial for drawing MS Range Bar chart to PDF file